Nearshore Sand Deposit Mapping with Electrical Resistivity Tomography (ERT)

Want to know more?

Get in touch with us for expert help.

Marine Resistivity Investigations for Subsurface Sand Characterization

Summary: Marine electrical resistivity tomography (ERT) measurements were successfully used to delineate the thickness and distribution of nearshore marine sand deposits along the coastal area of Terengganu, Malaysia.

Project

Method: Resistivity

Solution: ABEM Terrameter LS 2 with a 155 m long marine resistivity cable.

Measurement: Wenner array. Electrode spacing 5 meters. 

Software for processing and interpretation: Res2DInv from Seequent.

In collaboration with:

Solution for investigating nearshore sand deposits

The investigation of the nearshore sand deposits was carried out as ERT (Electrical Resistivity Tomography) with an ABEM Terrameter LS2, equipped with a 155-meter-long marine cable.

A team of professional divers was used to help with the setting out of the cable on the seabed.

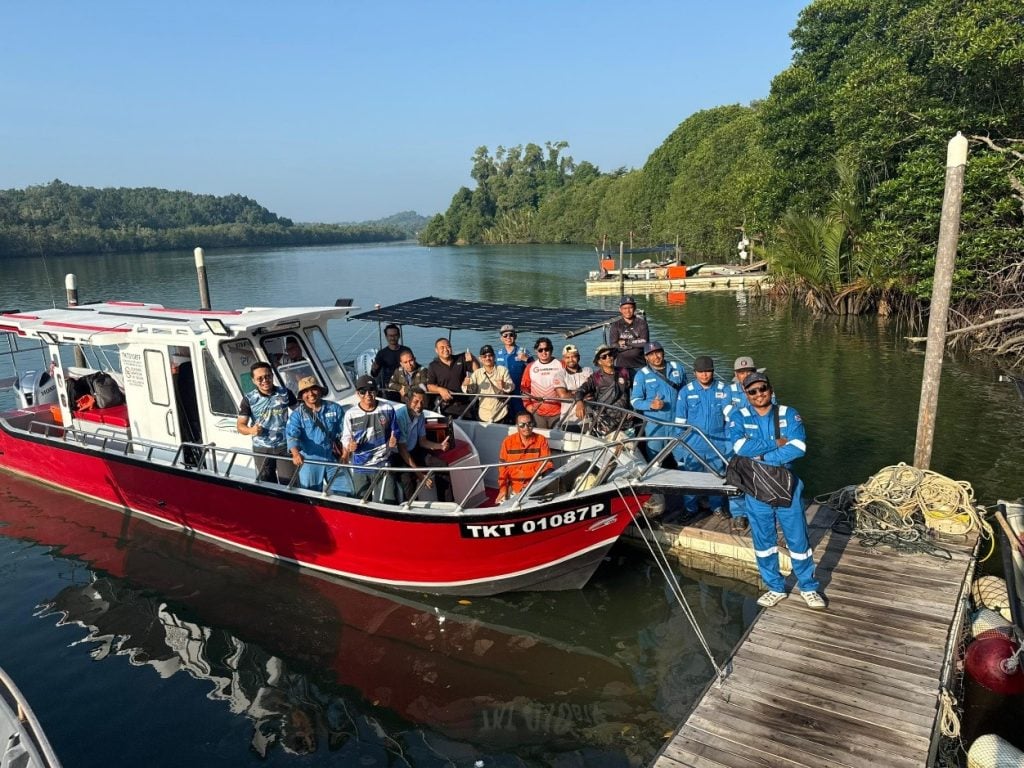
The-investigation-team-that-did-the-Marine-ert-survey
The investigation team

The challenge when working with ERT on water

An increasing demand of near coastal development necessitated a better understanding of the subsurface along the cost of Terengganu in Malaysia. The area lacks information from borehole data and surface observation, so overall geological information was needed in the first phase.

For this, resistivity investigations were carried out, from the sea and up on the shore. Working in water can be challenging in many ways, and so the following is good to keep in mind:

  • Monitor the tidal level, wind, and weather forecasts
  • Tether lines can be used to maintain the profile orientation
  • Ensure that the sea currents do not cause drift or sweep away the measurement cable. This can be done by stabilising the cable by weights or bury it.
  • For better overview of the measurement set up, surface buoys can be used to mark key electrode locations at sea
Resistivity survey from a boat
Resistivity investigations at sea. An electrode location is marked by a buoy on the left-hand side.

Results & Conclusion

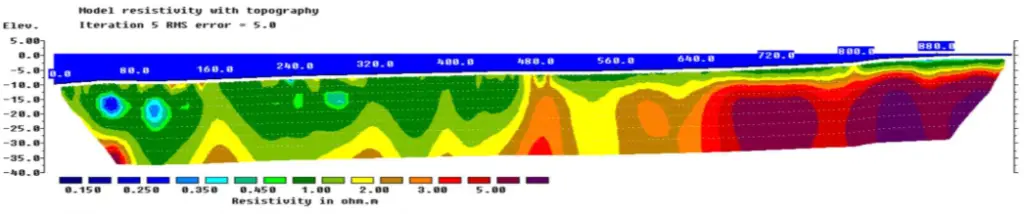
The ERT investigation gave a clear result of the seabed conditions. From the sea towards land, the resistivity steadily increased. The object of interest, the sand, thins significantly, with thickness decreasing to less than 5 meters.

The rresistivity value transition to 2.5–5.0Ωm corresponds to terrestrial sediments, such as compacted sand, silts, or mixed soils. This segment also marks the inland boundary of the marine sand zone. Deposits are shallow and potentially overprinted by coastal or aeolian processes.
ERT results marine study using an ABEM Terrameter LS2
The ERT results, from sea (left) to the shore (right) Blue and green values correspond to low resistivities and read and purple to higher resistivity.

More to read on ERT and Marine Surveys

Acknowledgement

We would like to thank the Mineral and Geoscience Department (JMG, https://www.jmg.gov.my) and the National Water Research Institute of Malaysia (NHARIM, https://www.nahrim.gov.my) for sharing the information.

The full paper (Azrul Normi Idris et. al., (2025) Marine Resistivity Imaging for Subsurface Sand Characterization along the Chendering Coastline, Terengganu) was presented at the 38th National Geoscience Conference, in Tawau, Sabah, Malaysia, the 18th September 2025.

More reading

How ERT and TEM Surveys Solved a Water Crisis on Remote Island: From 10 to 100 Tons per Day

From 10 to 100 tons of groundwater yield per day: …

ERT-Based Subsoil Assessment to Support Reliable Foundation Design

Supporting safe foundation design using Electrical Resistivity Tomography (ERT)…

Finding Groundwater for a Plantation using TEM

Finding Groundwater for a Durian Orchard using Transient Electromagnetic (TEM)…

Newsletter

Sign up for Guideline Geo’s newsletter and be the first to know.